The Number and What It Actually Represents
52.5% of all science and technology workers in the European Union are women. That translates to 42.8 million people out of a total science and technology workforce of 81.6 million. This is not a projected figure, not a best-case scenario drawn from a favourable sample, and not a target from a diversity strategy document. It is Eurostat’s 2025 measurement of the current composition of the EU science and technology workforce.
The figure is worth pausing on, because it contradicts a narrative that is still widely repeated in discussions about gender and technical careers – the narrative that science and technology remain male-dominated fields where women are underrepresented and progress is slow. At the aggregate EU level, that narrative is simply not accurate. Women are the majority. The question worth asking is not whether women are present in science and technology, but how that majority is distributed across different parts of the sector and different parts of Europe.
Where the Numbers Are Highest
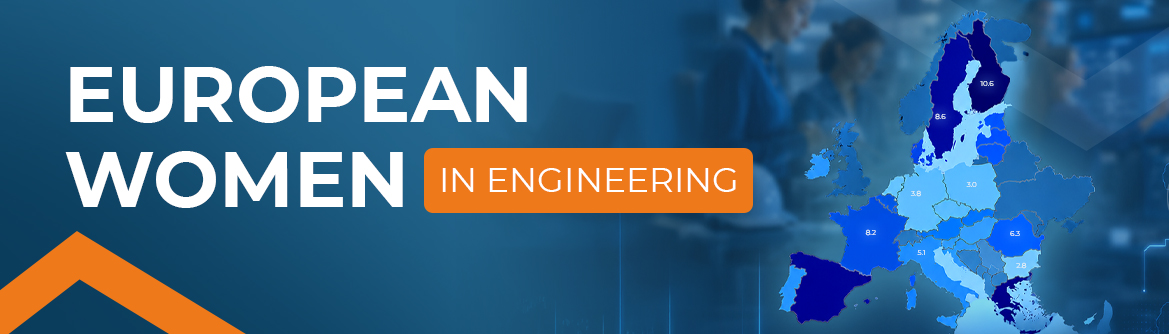
The regional distribution of the 52.5% figure reveals patterns that are more interesting than the aggregate number alone. Latvia leads the EU ranking at 62.4% – meaning that nearly two in three science and technology workers in Latvia are women. Estonia follows at 60.5%, and Hungary’s Great Plain and North region reaches 61.1%. These are not marginal differences from the EU average. They represent a fundamentally different composition of the technical workforce, and they have been near the top of this ranking consistently enough that the pattern cannot be attributed to short-term variation.
Countries that have maintained majority-female science and technology workforces for an extended period have done so through a combination of educational pathways, labour market structures, and cultural expectations about technical careers that developed differently from the Western European norm. The mechanisms are not fully captured in the aggregate statistics, but the outcomes are clear. Some parts of Europe built their technical workforce with a different gender composition from the start, and that composition has persisted and strengthened over time.
Where the Gap Remains
The bottom of the EU ranking tells a different story. Corsica records 42.7%, Malta 46.0%, and France’s Centre region 47.2%. The spread between the highest and lowest regional figures within the same economic bloc is nearly 20 percentage points – a gap that is large enough to be analytically significant and that tracks closely with a structural variable: the composition of the local science and technology employment base.
Regions where science and technology employment is concentrated in healthcare, research, education, and public services consistently score higher on the female share metric. Regions where the same employment category is dominated by heavy industry, manufacturing, and extractive sectors consistently score lower. The correlation is not perfect, but it is strong enough to suggest that the sectoral composition of the regional economy is one of the primary drivers of the gender distribution within the science and technology workforce.
This matters for how the 52.5% figure is interpreted. The EU-level majority does not mean that the gender gap has closed uniformly across all technical fields. It means that in the fields where women have historically been well represented – healthcare, life sciences, research – the numbers are high enough to pull the aggregate above 50%. In manufacturing and heavy industrial engineering, the picture is different.
What This Means for Industrial Engineering
Manufacturing is one of the fields where the gender gap remains clearly visible, and the regional data reflects this. The parts of Europe where heavy industry and manufacturing represent a larger share of science and technology employment are the parts where the female share of that workforce is lowest. The correlation is consistent and the gap is real.
What is also real, and less often acknowledged, is that the gap is closing – and the women closing it are not doing so quietly or in marginal roles. They are leading engineering projects, managing technical teams, and delivering work that the industry depends on. The change is not happening at the level of statistics alone. It is happening at the level of individual engineers and project teams, in the ordinary course of technical work, in organisations that have found that the composition of their engineering team matters less than the quality of the engineering it produces.
The 52.5% is a real number at the EU level. In some regions and some technical fields, it represents a majority that has been the norm for longer than most people in industrial engineering realise. In others, it represents a direction of travel rather than a current reality. Both of those things are worth knowing.
The Workforce That Is Already Here
Discussions about women in engineering often focus on the pipeline – on educational programs, on attracting young women into technical studies, on the long-term structural changes that will produce a different workforce in ten or twenty years. That framing is not wrong, but it can create the impression that the change is primarily a future project rather than a present reality.
The Eurostat data is a reminder that the change is already significantly advanced. 42.8 million women working in science and technology across the EU is not a pipeline. It is a workforce. The engineers, researchers, and technical specialists represented in that number are already doing the work – already contributing to the projects, the products, and the technical decisions that the European economy runs on.
The 52.5% figure will continue to be cited in discussions about gender and technical careers, usually as evidence that progress is being made. What it actually represents is something that has already happened, at a scale that most of those discussions have not fully absorbed.
Interested in working with GFE Solutions?
We provide engineering capacity across CAD, FEM, CNC, PLC and piping – to manufacturing companies across Europe.
Get in touch
Source: Eurostat, 2025